Electric Imp today added a new debugging tool to its Ops Console to give customers access to information about a specific device, imp or agent, whether it is in production, development or the factory. Using this new tool, customers with Ops Console permission can access information such as an imp’s last connection date, confirmation that a device is blessed (or not), and the last known agent for a given device. This data, and more, will assist in the debugging process and provide better customer support.

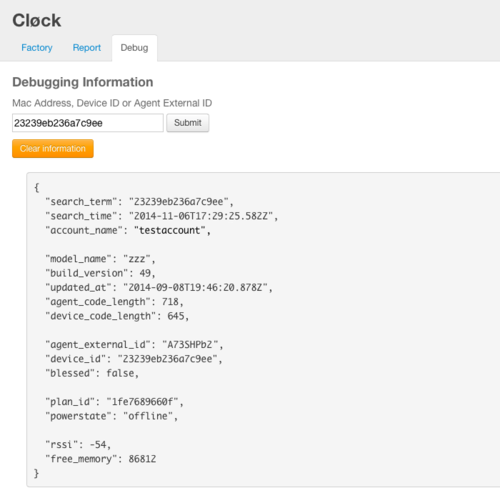
To use the new tool, go to the ‘Debug’ tab in the Ops Console, enter the device’s ID, imp’s MAC address or agent’s external ID in the search field and click on ‘Submit’. The search result is currently presented in the workspace in raw JSON format since it is the data structure we will be using with our forthcoming IDE API. For now, the data can be highlighted with your mouse and copied to a text editor and saved. We have plans to update the Ops Console UI to present results in a way that will make them more readable at a glance.
Additionally, we have updated the Ops Console UI in this release. All the existing features are still available but now arranged in three tabs – Factory, Report and Debug – to provide a more manageable interface for tracking production and factory devices.

Ben Day
Frontend Developer