Customers helping their end-users resolve technical difficulties have been given a powerful new support tool in the the Electric Imp Ops Console which allows the ability to log activity from individual production devices. It is called Production Logging.
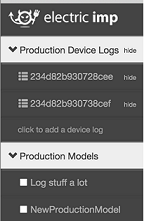
Previously, because production devices were not listed in the Electric Imp IDE, customers could not view information posted to those devices’ logs. From today, up to five devices can be monitored temporarily, allowing support staff to view logs posted by a production device in near real time.
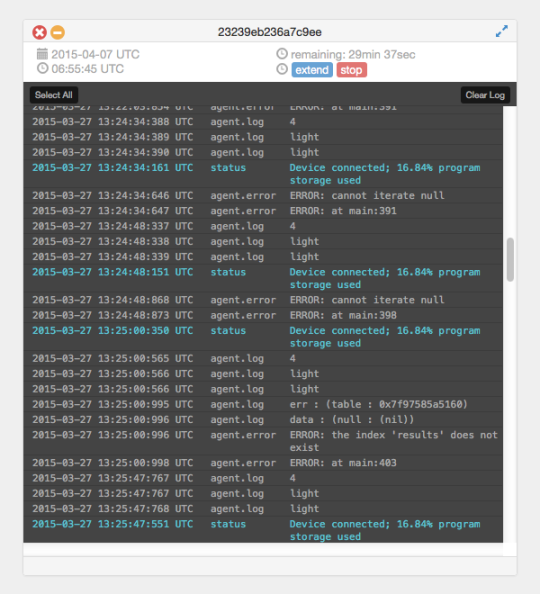
Production Logging presents support staff with all the log entries a developer might expect to see in the IDE log: device start-up, connection and disconnection times; errors generated by application firmware code; other errors, such as recorded WiFi outages; and any messages posted by code using the impOS API call server.log().
For example, the support staff can use Production Logging to quickly study device behavior. They can, for instance, ask the end-user to power-cycle the device, and then view the messages posted by the device as it restarts, connects to the Electric Imp Cloud and begins operation.
With this information in hand, the support staff can see how the end-user’s device is behaving in the field. The data might suggest issues with the end-user’s wireless network, for example, or a misconfiguration or incorrect installation.
Production Logging can be enabled for a specific device, for up to five devices, by inputting a device’s Device ID and . Enter that ID into the Ops Console’s new Logging section and for the next 30 minutes, that device’s log entries will appear on screen. If a device needs to be monitored for longer, the logging time can be extended in five-minute increments from the Production Logging interface.
The log text is selectable, allowing the information to be copied and pasted into a support incident record.
Ben Day,
Frontend Developer